ggplotly
ggplotly
ggplotly(p = ggplot2::last_plot(), width = NULL, height = NULL,
  tooltip = "all", dynamicTicks = FALSE, layerData = 1,
  originalData = TRUE, source = "A", ...)
Examples
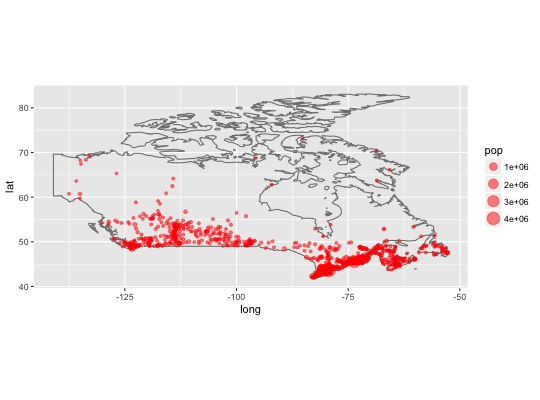
library(ggplot2) data(canada.cities, package = "maps") viz <- ggplot(canada.cities, aes(long, lat)) + borders(regions = "canada") + coord_equal() + geom_point(aes(text = name, size = pop), colour = "red", alpha = 1/2)#> Warning: Ignoring unknown aesthetics: textvizp <- ggplotly(viz, tooltip = c("text", "size")) p$elementId <- "ggplotly" p$x$cur_data <- p$elementId p